Folks working with MS Operations Manager use a whole bunch of queries which help them troubleshoot and optimize their SCOM environment.
However, running whole of the bunch takes time and is not the smoothest way to do your daily work.
Together with approvedconsulting.com and Danny Hermans from Microsoft we took the best of queries made by SCOM community and created the Operations Manager Health Check report.
This report brings together all of the most important aspects Operations Manager health checks. Additionally visual aids (like color variations and clean PerceptualEdge-style design) are used to direct the users of the report to the critical issues.
Here are the screenshots of v1.0 of this report.
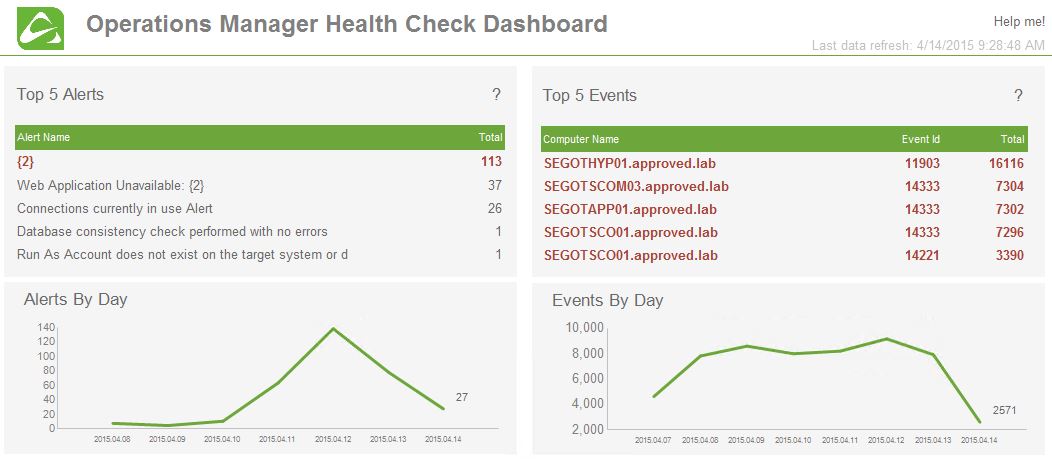
Section of Health Check report which visualizes trends of alert and event counters
First, the two most important measurements- Event and Alert counters. Since these tend to go wild now and then due to problems in SCOM setup, it is important to catch the misbehaving counters ASAP. Trend lines over days of last week and Top 5 tables illustrate this information in the best way. I’ve also added the value to the last data point in the charts to help users get a better feel of the value quickly.
Teams, responsible for SCOM environments would need to find out what a certain Event ID means and they do that by first searching eventid.net. That is why I tied values from Event Id column to a dynamic link pointing to a search page on eventid.net; this way they just need to click on the code which interest them and a report for that specific event is shown (provided that it exists in the database of eventid.net).
Each logical section of the report is separated by a very pale gray background. No harsh borders that clutter the view, just enough for visual separation.
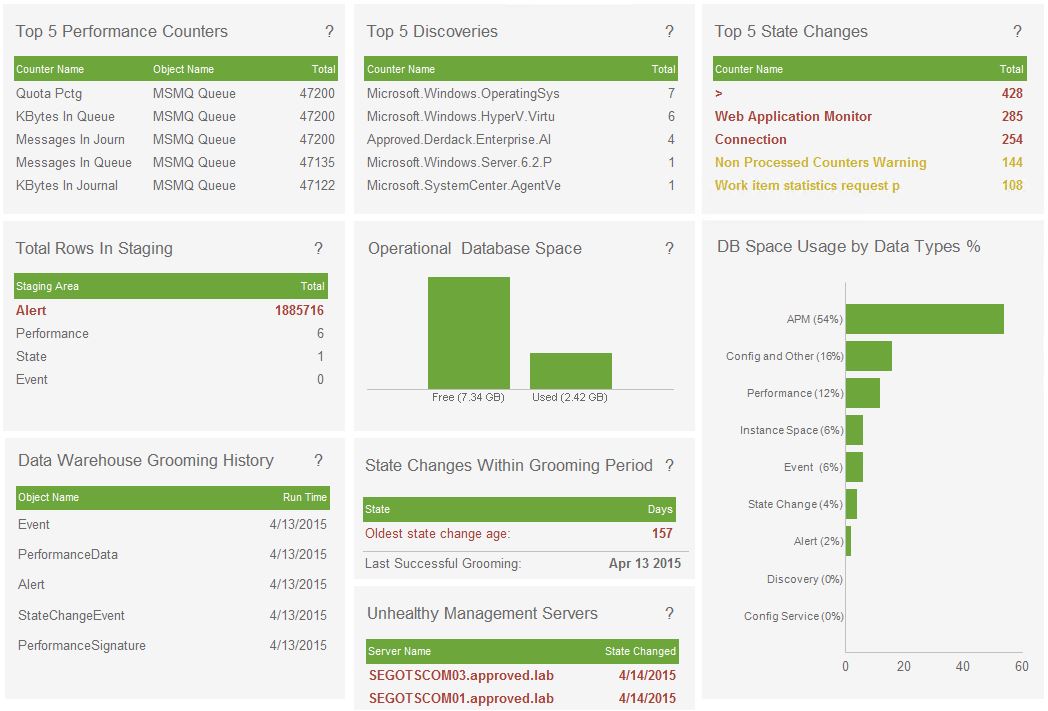
Additional information about SCOM health status. Includes Performance counters, discoveries, state changes, grooming information, storage and others.
The bottom section of this report shows more details on other areas of interest such as Discoveries, State Changes, Staging status, used vs free DB space and a bar chart for comparing DB space usage by different types of data being stored.
Same color scheme is applied to all areas of this report where red indicates that something requires immediate action, yellow text highlights items that are good to look into and gray text means all is normal. However, the thresholds which change the colors were different for every one of the report elements. That is why we have a ‘?’ next to most of the names. This is a link to the help page which explains all the details about the specific item, such as what the colors mean and what actions should be taken in order to take care of the problem.
SSRS was chosen for this particular project mostly because of integration with SCOM environment. SSRS reports can become another entry among other things SCOM admins are used to. Convenience is an important factor!
Since most of the data source queries were written by other SCOM admins, this is a report which Approved Consulting is giving away. So grab your free copy of the Operations Manager Health Check Report management pack from here!
Be the first to comment.